One of the most common questions that people ask me is, “Where can I find business stories?” I’ve written extensively on this subject in blog posts such as:
- Looking for B2B Story Ideas? Start with your Purchase Orders
- The Best Business Stories are Found in the Sewer
- Why Most Companies Have a Difficult Time Finding Stories and How to Fix It
- If You Can’t Find Your Business Story, Look Elsewhere
- The Best Stories Come From the Worst Examples
Most of the methods mentioned in these articles rely on a storyteller’s observation skills and the ability to find patterns where others don’t. But, what if these human ways of finding stories aren’t feasible?
Take Big Data for example. According to IBM, “Every day, we create 2.5 quintillion bytes of data — so much that 90% of the data in the world today has been created in the last two years alone.” A quintillion is an unfathomable number to the human brain. It’s formed by placing a one before eighteen zeros. So, while Mount Big Data may be packed with potential stories, extracting them will require help. IBM has addressed this need by opening Watson Analytics to anyone willing to throw data at it. As a storyteller looking to upgrade his story-finding skills, I opened an account.
The hardest part of learning Watson Analytics wasn’t the tool; it was figuring out what data to process. Watson comes with “sample data,” but I learn best when applying new technologies to something that interests me. That’s when I thought of my favorite sport and wondered. “If I upload the Team Statistics from the 2015 NFL Season, could Watson unearth some story-starter nuggets that I couldn’t have found on my own?” In other words, what if I used Watson Analytics to find a Moneyball for football story?
It took me a few hours to create an Excel spreadsheet that contained over 160 stats for all 32 clubs. However, since the free version of Watson Analytics limits the amount of data to fifty categories, I was forced to whittle my massive spreadsheet down.
Watson’s “Predict” function took less than a minute to chew on 1,600 pieces of data (50 categories x 32 teams) and spit out “121 strong associations.” Although most were “No-duh!” obvious, such as Offensive Penalty Yards were positively correlated with Offensive Penalties and Total Rush Yards were positively correlated with Rush Attempts, one association stopped me in my tracks.
The correlation between number of Rush Attempts Defended and Passer Rating (r=0.60) is strong. As the number of Rush Attempts Defended increases, there is a strong tendency for Passer Rating to decrease.
This was exactly the type of counterintuitive correlation that I was hoping to find. The best data-inspired stories begin with Wait? What? questions and this potential association had me asking: “How could statistics about players who were never on the football field at the same time be related?”
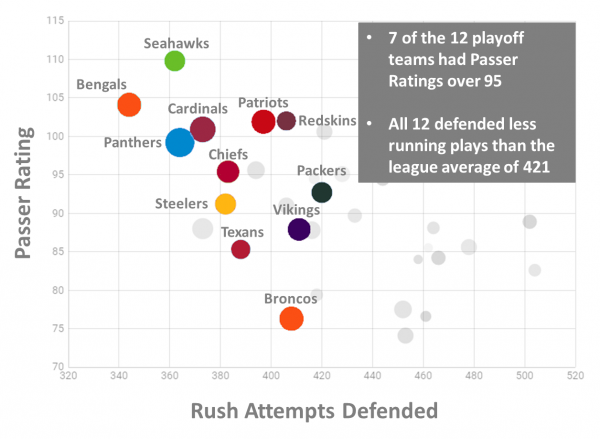
The following chart illustrates the correlation between a team’s Passer Rating and the number of times that same team defends running plays.

The next chart highlights the twelve teams that made the playoffs in 2015. Note that all twelve defended less running plays than the league average of 421.
So, did Watson Analytics find a Moneyball for football stat? Maybe. We’d need to test the premise over more than one season to be sure. But either way, Watson did its job. It extracted the raw materials for a storyteller to begin processing into gold.
Does your business want to mine Big Data? If so, put tools like Watson Analytics into the hands of your business storytellers. Competitive advantages belong to enterprises that can find and tell unique data stories before anyone else.
Sources: